The Berwald Group

612-669-0596

  • Home
  • Featured Listings
  • Our Sold Listings
  • Aerial Images
  • Search Homes
  • Resources
    • Sellers
    • Buyers
  • About
    • Our Mission
  • Contact

Page 94 of 95« First«...102030...9192939495»
Monday, April 19th, 2021

Inventory hits an 18-year low with buyers competing for fewer listings

(April 16, 2021) – According to new data from the Minneapolis Area REALTORS® and the Saint Paul Area Association of REALTORS®, the median price of a home in the 16-county Twin Cities metro increased 10.3 percent from last March to a record high of $327,500. Prices were driven in part by a lack of supply.

The number of homes for sale at the end of March was half of what was available a year ago. That marks an 18-year low and amounts to 0.9 months of supply. A balanced market typically has 4-6 months of supply. Market times shrank 37.7 percent to 38 days and multiple offers remain commonplace.
“Demand is still growing faster than supply,” according to Tracy Baglio, President of the Saint Paul Area Association of REALTORS®. “With less than one month of supply, buyers must be patient and understand they may lose out on a few bids before an offer is accepted. Be ready to act fast.”

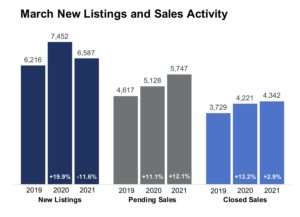
Sellers listed 11.6 percent fewer homes than March 2020, offering little relief to buyers eager for more options. However, sales activity climbed above year-ago levels for the tenth straight month. Buyers continue to be motivated by attractive mortgage rates, a healing labor market and a desire for more space.

“On top of lightning-fast market times, those who choose to sell their home are often rewarded with offers at or above asking price,” said Todd Walker, President of Minneapolis Area REALTORS®. “For buyers, that means writing strong, straightforward offers right away. For sellers, it means their listings will stand out and will likely sell quickly at full price or better.”
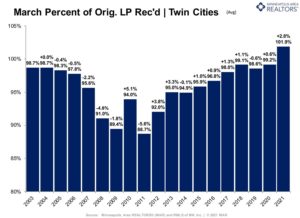
Activity varies by area, price point and property type. Sales were up 31.9 percent in Minneapolis and 9.5 percent in St. Paul, suggesting demand remains strong in the core cities. Condos sales rose 31.7 percent, outpacing single-family and townhomes. New construction sales rose 25.5 percent while previously owned homes rose 0.7 percent. Sales of luxury properties ($1M+) have been soaring—up 70.9 percent from last March.

March 2021 by the numbers compared to a year ago

  • Sellers listed 6,587 properties on the market, an 11.6 percent decrease from last March
  • Buyers signed 5,747 purchase agreements, up 12.1 percent (4,342 closed sales, up 2.9 percent)
  • Inventory levels fell 50.7 percent to 4,907 units
  • Months Supply of Inventory was down 52.6 percent to 0.9 months (4-6 months is balanced)
  • The Median Sales Price rose 10.3 percent to $327,500
  • Days on Market decreased 37.7 percent to 38 days, on average (median of 11, down 57.7 percent)
  • Changes in Sales activity varied by market segment
    • Single family sales were down 1.1 percent; condo sales rose 31.7 percent; townhome sales increased 8.7 percent
    • Traditional sales rose 4.5 percent; foreclosure sales were down 42.9 percent; short sales fell 63.2 percent
    • Previously owned sales were up 0.7 percent; new construction sales climbed 25.2 percent
From The Skinny Blog.

Posted in The Skinny |
Monday, April 12th, 2021

Posted in The Skinny |
Monday, April 12th, 2021

Posted in Weekly Report |
Monday, April 12th, 2021

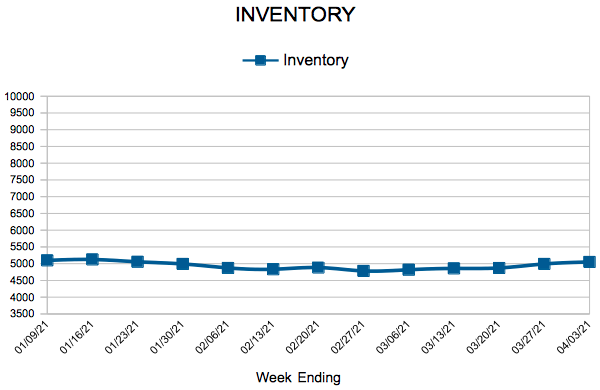
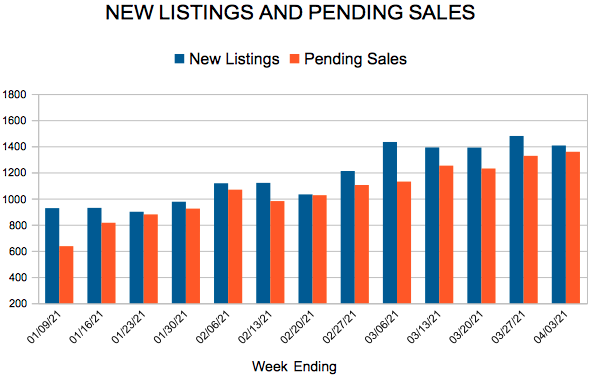
For Week Ending April 3, 2021

The University of Michigan’s latest Consumer Sentiment Index came in at 84.9 points, up from 76.8 in February and the highest level since last March’s 89.1 reading. The index is an economic indicator of the overall health of the economy as determined by consumer opinion. Increasing values point to increasing consumer confidence in their own financial health and the health of the overall economy.

In the Twin Cities region, for the week ending April 3:

  • New Listings decreased 7.6% to 1,406
  • Pending Sales increased 21.8% to 1,358
  • Inventory decreased 49.4% to 5,051

For the month of February:

  • Median Sales Price increased 11.5% to $314,000
  • Days on Market decreased 31.3% to 46
  • Percent of Original List Price Received increased 2.1% to 100.1%
  • Months Supply of Homes For Sale decreased 47.1% to 0.9

All comparisons are to 2020

Click here for the full Weekly Market Activity Report. From MAAR Market Data News.

Posted in Weekly Report |
Monday, April 5th, 2021

Posted in The Skinny |
Monday, April 5th, 2021

Posted in Weekly Report |
Monday, April 5th, 2021

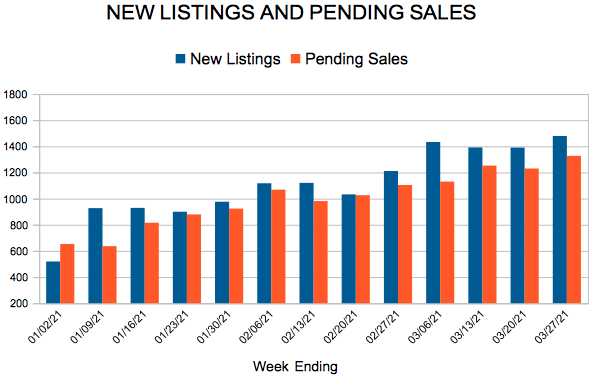
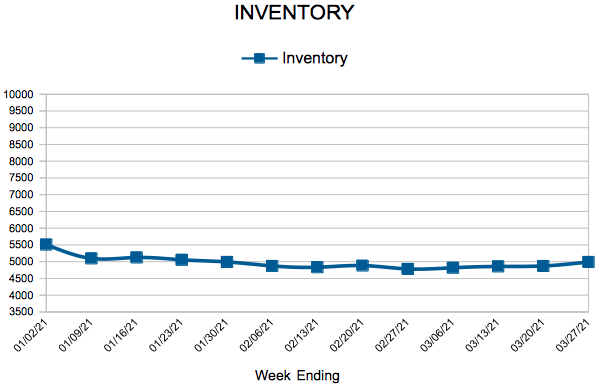
For Week Ending March 27, 2021

As the spring market is in full swing and home prices are ticking up, mortgage rates have moved higher in recent weeks as well. Freddie Mac reports that the national average rate for a 30-year fixed-rate mortgage rose to 3.17% with an average of .6 points. While rates are still below the average of 3.5% for the same week last year, the year over year comparison has been tightening in recent weeks.

In the Twin Cities region, for the week ending March 27:

  • New Listings decreased 3.8% to 1,479
  • Pending Sales increased 15.5% to 1,327
  • Inventory decreased 49.0% to 4,992

For the month of February:

  • Median Sales Price increased 11.5% to $314,000
  • Days on Market decreased 31.3% to 46
  • Percent of Original List Price Received increased 2.1% to 100.1%
  • Months Supply of Homes For Sale decreased 47.1% to 0.9

All comparisons are to 2020

Click here for the full Weekly Market Activity Report. From MAAR Market Data News.

Posted in Weekly Report |
Monday, September 26th, 2016

For Week Ending September 17, 2016

As temperatures start to cool throughout the country, the total number of home sales will cool as well, as is the seasonal nature of the housing market. But with household incomes on the rise within a healthy job market, that doesn’t necessarily equate to a downward year-over-year trend. Continuing supply restrictions will certainly have an effect on numbers that may otherwise obviously point toward sunny day real estate.

In the Twin Cities region, for the week ending September 17:

  • New Listings decreased 0.9% to 1,603
  • Pending Sales decreased 1.5% to 1,079
  • Inventory decreased 17.3% to 14,177

For the month of August:

  • Median Sales Price increased 5.6% to $237,500
  • Days on Market decreased 14.1% to 55
  • Percent of Original List Price Received increased 0.8% to 97.9%
  • Months Supply of Inventory decreased 21.6% to 2.9

All comparisons are to 2015

Click here for the full Weekly Market Activity Report. From The Skinny Blog.

Posted in Weekly Report |
Monday, September 26th, 2016

Posted in Monthly Skinny Video |
Monday, September 19th, 2016

For Week Ending September 10, 2016

During a point in time when record-low mortgage rates should be coercing new home buyers into the market, many potential first-time buyers are seemingly not able to afford what is on the market. As labor costs and demand grow, and as a construction labor shortage continues, builders tend toward building more expensive homes, creating a tight supply of entry-level homes. Not all situations match this scenario, but it is certainly an interesting time in the residential real estate marketplace.

In the Twin Cities region, for the week ending September 10:

  • New Listings increased 11.0% to 1,722
  • Pending Sales decreased 2.0% to 954
  • Inventory decreased 17.4% to 14,011

For the month of August:

  • Median Sales Price increased 5.6% to $237,500
  • Days on Market decreased 14.1% to 55
  • Percent of Original List Price Received increased 0.8% to 97.9%
  • Months Supply of Inventory decreased 24.3% to 2.8

All comparisons are to 2015

Click here for the full Weekly Market Activity Report. From The Skinny Blog.

Posted in Weekly Report |
Page 94 of 95« First«...102030...9192939495»
  • What is my home worth?
  • News
  • Calculators
  • Finding A Loan Officer
  • Mortgage Glossary
  • The Loan Process
  • Metro Markets
  • Facebook
  • LinkedIn
  • Twitter
  • YouTube
Cell: 612-669-0596 | LanceBerwald@kw.com
Cell: 612-201-8311 | DavidPaulson@kw.com
Realtor & Housing
Licensed In Minnesota

All information deemed reliable but not guaranteed and should be independently verified.

By searching you agree to the end user license agreement.

DMCA Copyright Notice.

Copyright © 2025 | DawnInk LLC