The University of Michigan’s latest Consumer Sentiment Index came in at 84.9 points, up from 76.8 in February and the highest level since last March’s 89.1 reading. The index is an economic indicator of the overall health of the economy as determined by consumer opinion. Increasing values point to increasing consumer confidence in their own financial health and the health of the overall economy.
In the Twin Cities region, for the week ending April 3:
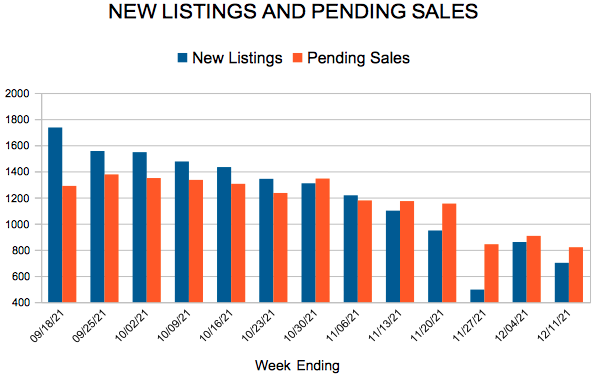
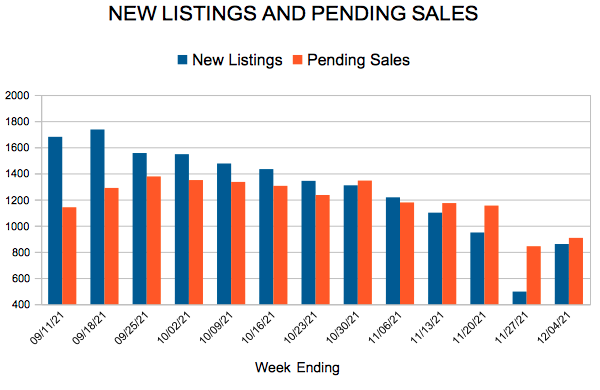
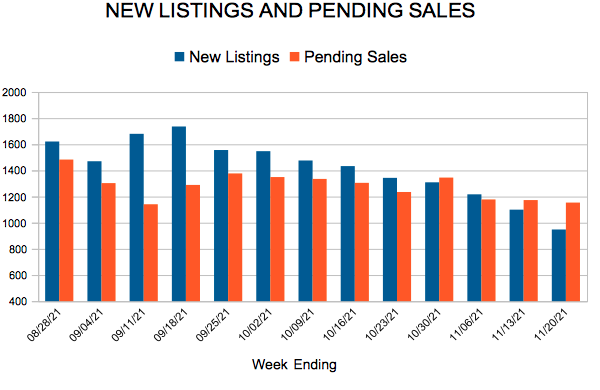
- New Listings decreased 7.6% to 1,406
- Pending Sales increased 21.8% to 1,358
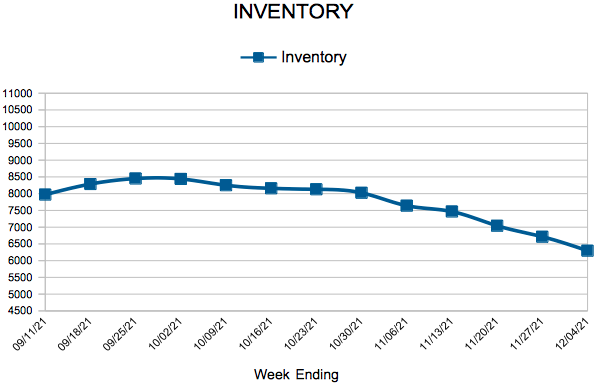
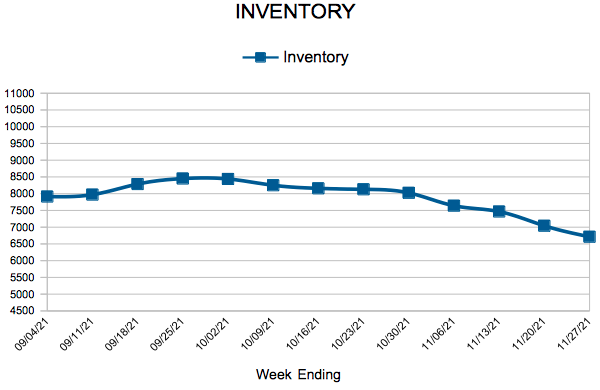
- Inventory decreased 49.4% to 5,051
For the month of February:
- Median Sales Price increased 11.5% to $314,000
- Days on Market decreased 31.3% to 46
- Percent of Original List Price Received increased 2.1% to 100.1%
- Months Supply of Homes For Sale decreased 47.1% to 0.9
All comparisons are to 2020
Click here for the full Weekly Market Activity Report. From MAAR Market Data News.
As the spring market is in full swing and home prices are ticking up, mortgage rates have moved higher in recent weeks as well. Freddie Mac reports that the national average rate for a 30-year fixed-rate mortgage rose to 3.17% with an average of .6 points. While rates are still below the average of 3.5% for the same week last year, the year over year comparison has been tightening in recent weeks.
In the Twin Cities region, for the week ending March 27:
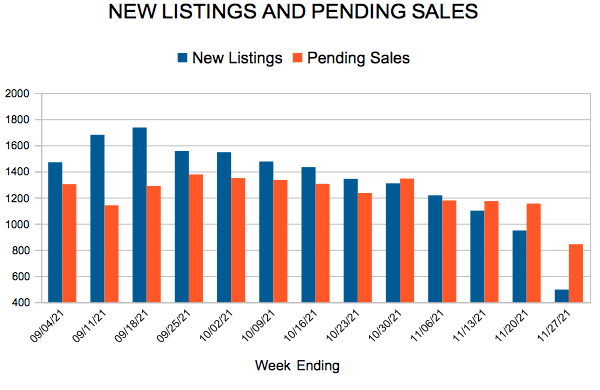
- New Listings decreased 3.8% to 1,479
- Pending Sales increased 15.5% to 1,327
- Inventory decreased 49.0% to 4,992
For the month of February:
- Median Sales Price increased 11.5% to $314,000
- Days on Market decreased 31.3% to 46
- Percent of Original List Price Received increased 2.1% to 100.1%
- Months Supply of Homes For Sale decreased 47.1% to 0.9
All comparisons are to 2020
Click here for the full Weekly Market Activity Report. From MAAR Market Data News.
For Week Ending September 17, 2016
As temperatures start to cool throughout the country, the total number of home sales will cool as well, as is the seasonal nature of the housing market. But with household incomes on the rise within a healthy job market, that doesn’t necessarily equate to a downward year-over-year trend. Continuing supply restrictions will certainly have an effect on numbers that may otherwise obviously point toward sunny day real estate.
In the Twin Cities region, for the week ending September 17:
- New Listings decreased 0.9% to 1,603
- Pending Sales decreased 1.5% to 1,079
- Inventory decreased 17.3% to 14,177
For the month of August:
- Median Sales Price increased 5.6% to $237,500
- Days on Market decreased 14.1% to 55
- Percent of Original List Price Received increased 0.8% to 97.9%
- Months Supply of Inventory decreased 21.6% to 2.9
All comparisons are to 2015
Click here for the full Weekly Market Activity Report. From The Skinny Blog.
For Week Ending September 10, 2016
During a point in time when record-low mortgage rates should be coercing new home buyers into the market, many potential first-time buyers are seemingly not able to afford what is on the market. As labor costs and demand grow, and as a construction labor shortage continues, builders tend toward building more expensive homes, creating a tight supply of entry-level homes. Not all situations match this scenario, but it is certainly an interesting time in the residential real estate marketplace.
In the Twin Cities region, for the week ending September 10:
- New Listings increased 11.0% to 1,722
- Pending Sales decreased 2.0% to 954
- Inventory decreased 17.4% to 14,011
For the month of August:
- Median Sales Price increased 5.6% to $237,500
- Days on Market decreased 14.1% to 55
- Percent of Original List Price Received increased 0.8% to 97.9%
- Months Supply of Inventory decreased 24.3% to 2.8
All comparisons are to 2015
Click here for the full Weekly Market Activity Report. From The Skinny Blog.
Seller activity increased 2.1 percent since last August, as sellers introduced 7,072 new listings to the marketplace. Buyer activity also rallied. Pending sales rose 7.9 percent while closed sales gained 7.4 percent. To fuel those gains, buyers signed 5,728 new contracts and closed on 6,382 homes. That closed sales figure is on par with 2004 levels. Although the median sales price has reached its seasonal peak for 2016, it increased 5.7 percent since August 2015 to $237,750. Adding to the pressure facing buyers, inventory levels fell 18.8 percent to 13,933 active properties. Inventory constraints haven’t slowed down buyers yet, but additional listings are needed to ease the contentious landscape.
Low inventory has enabled homes to sell in near record time. Average days on market until sale fell 14.1 percent to 55 days. That’s the second fastest market time for any month since the beginning of 2007. The average percent of original list price received at sale was 97.9 percent, the highest figure for any August since 2005. Months supply of inventory fell 24.3 percent to 2.8 months—the lowest August figure on record since the beginning of 2003. Generally, five to six months of supply is considered a balanced market. This indicator measures the balance between supply and demand in the marketplace.
“Absorption rates under 3.0 months suggests things are still pretty tight out there as we transition to autumn,” said Judy Shields, Minneapolis Area Association of REALTORS® (MAAR) President. “But there are still peculiarities across locations and segments. Blaine is not Linden Hills and downtown condos are not suburban single family new construction. It’s important to have all the facts before making a move.”
Despite the fact that both seller and buyer activity increased in August, important asymmetries persist. Over the last three years, buyer activity has steadily marched higher while seller activity has essentially bounced around the 7,000 unit marker, thus straining supply levels.
A strong Twin Cities labor market has also helped promote housing recovery. The most recent national unemployment rate is 4.9 percent, though it’s a healthier 3.5 percent locally. The Minneapolis-St. Paul-Bloomington metropolitan area has the second lowest unemployment rate of any major metro area, trailing only Denver by 0.1 percent.
Locally, the 30-year fixed mortgage rate stands at 3.47 percent compared to a long-term average of about 8.0 percent. Rates are now at their lowest level in three years. Marginally higher rates were widely expected in 2016, but the Federal Reserve hasn’t made a move since last December. Markets currently peg the odds of a September rate hike at around 20.0 percent. Barring any surprising economic data, the Fed will likely raise rates this December.
“In the near term, buyer and seller activity always quiets down around this time of year and that shouldn’t cause concern,” said Cotty Lowry, MAAR President-Elect. “Over the long term, favorable interest rates, rising rents and a strong labor market should be conducive to housing. But we’ll need some additional inventory—particularly in the affordable brackets—in order to keep up with consumer demand.”